
1 Submitter demographics Tāpiritanga 1: Te taupori kaitāpae
Appendix 1: Submitter demographics
Tāpiritanga 1: Te taupori kaitāpae
Submitters who used the Royal Commission online portal to make their submission had the option to provide demographic data about themselves. This section presents that information, where it was given.
Age | Tau
Age of submitters
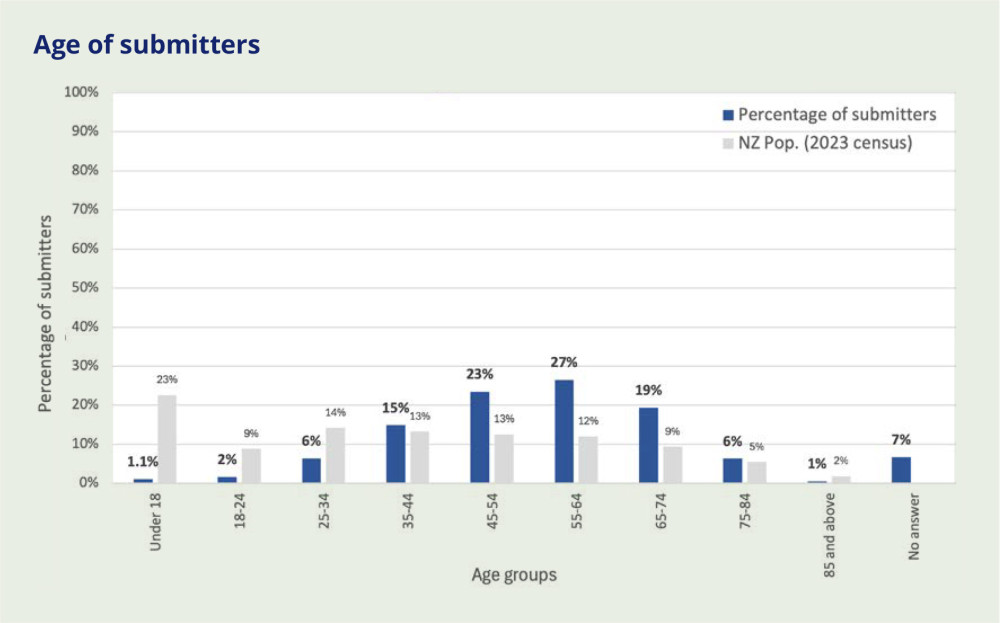
- Over half of submitters (53 percent) were aged over 55 years.
- Half of submitters (50 percent) were aged between 45 and 64, both cohorts within this group were significantly over-represented compared with the general population.
- Although 46 percent of the general population is aged under 35, just 9 percent of submitters were.
Note: Within Phase Two public submissions, detailed submissions were received that were written from the perspective of very young children.
Although written by adults, these submitters may have marked their age as <18.
Gender | Ira
Gender of submitters
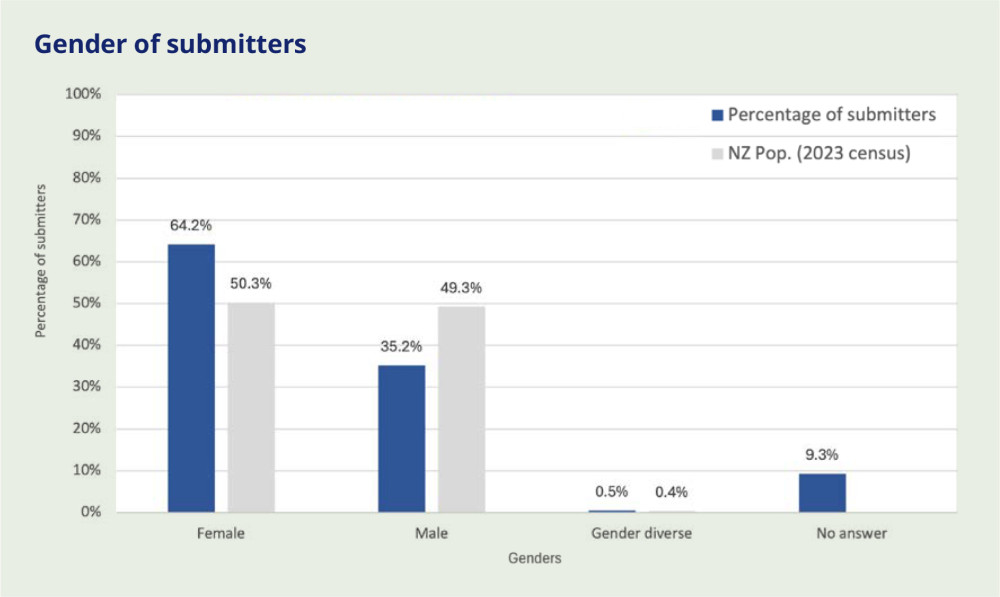
- Almost two-thirds of submitters were female, and just over a third male.
- Females were overrepresented compared with the population as a whole.
- Males were underrepresented.
- Gender-diverse people were well represented amongst submitters compared with the general population.
- 9 percent of submitters did not state their age bracket.
Region | Rohe
Location of submitters
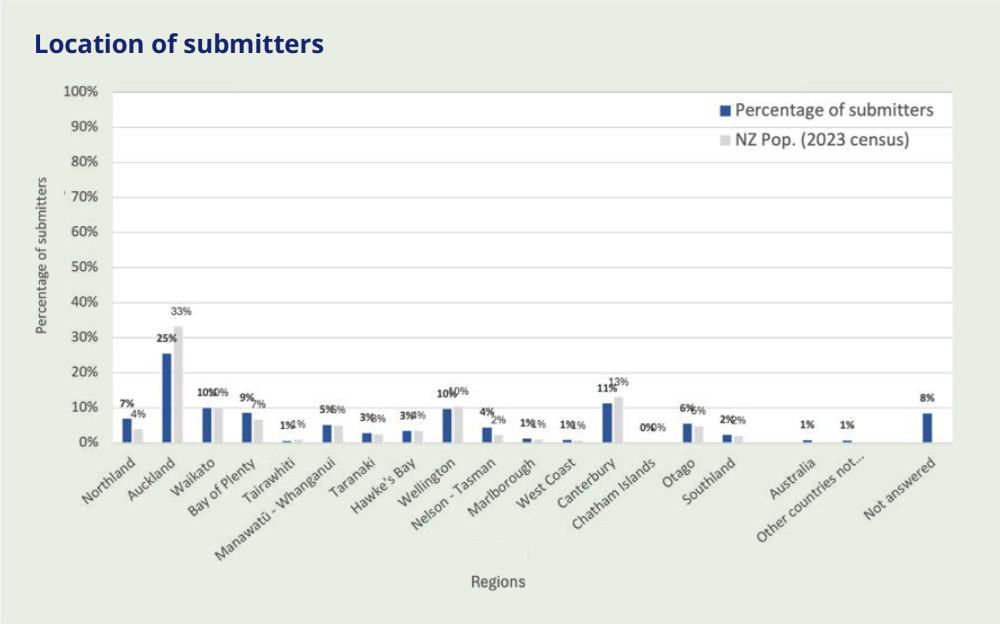
- 73 percent of submitters lived in the North Island, 26 percent in the South Island, less than 2 percent lived overseas
- Almost a third of submitters lived in Auckland (25 percent) or Northland (7 percent) during the COVID-19 response; Northlanders were over-represented; Aucklanders were under-represented.
- Canterbury, the Waikato, and Wellington each made up approximately 10 percent of submitters.
Ethnicity | Mātāwaka
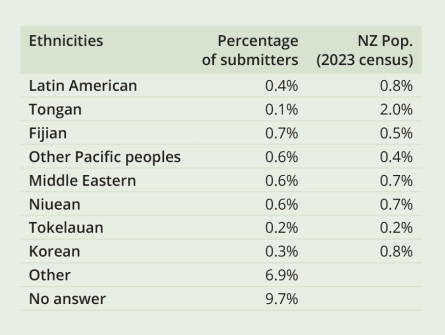
Ethnicity of submitters
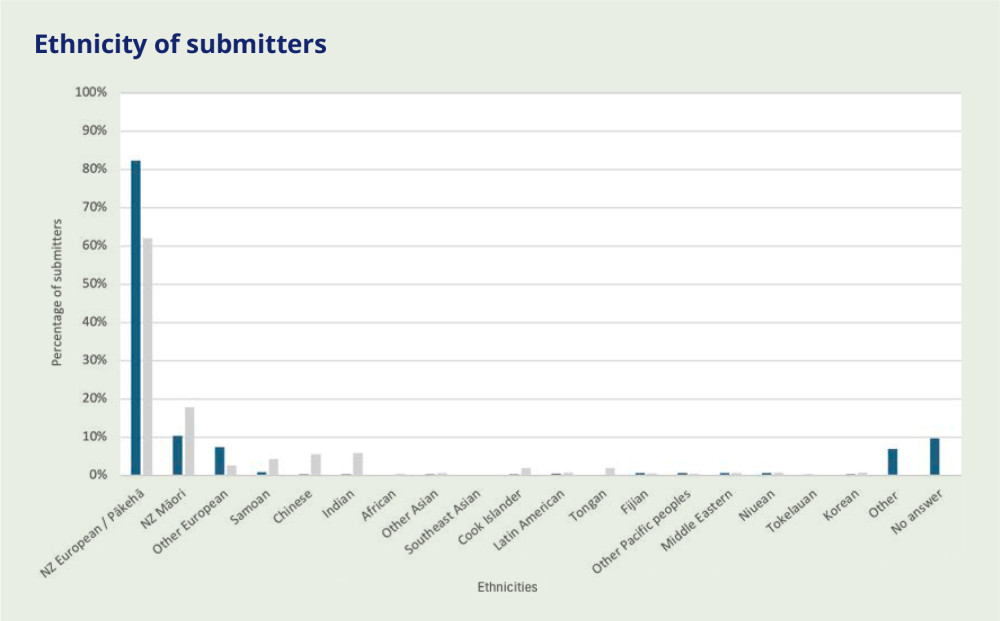
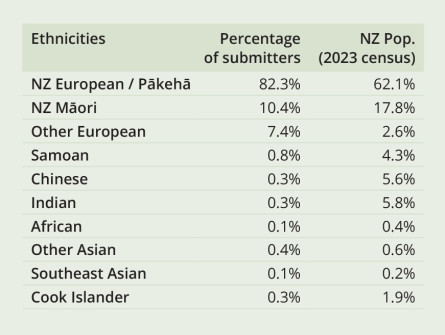

- The largest group of submitters were people who stated they are NZ European/Pākehā (82 percent), this group were overrepresented compared with the Aotearoa New Zealand population.
- 10 percent stated they were Māori, underrepresented compared with the overall population.
- 1 percent each stated they were Samoan, Chinese, Indian, African, and Other Asian.
- 10 percent did not answer this question.
- 7 percent gave another response, of those:
- 4 percent stated they were an ethnicity already provided.
- 2 percent gave another answer, listed below.
Commonly reported 'other' ethnicities:
- United Kingdom (64)
- North or South American (38)
- Celtic or Irish (32)
- Australian (20)
- Canadian (8)
- Native American (7)
- Jewish/Judean (5)
- Pakistani (4)
- Sri Lankan (3)
- Moriori (2)
- Caribbean (2)
- Romani (2)
- Rhodesian (1)
- A 'mix' (9): Any answer which stated a mix/mixture, without specifying ethnicities.
- Non-ethnicity answer (60): human/human being/Earthling, woman, man, other answers that were not ethnicities.
- Objected to answering (153): various objections to being classified by ethnicity, e.g., irrelevant, n/a, no, prefer not to say, why does it matter.
Note that many people used this space to express frustration or confusion about the purpose or intended use of collected demographic information or to make a statement to emphasise their position against the Government response to COVID-19.
Health conditions| Ngā āhuatanga hauora
Health conditions
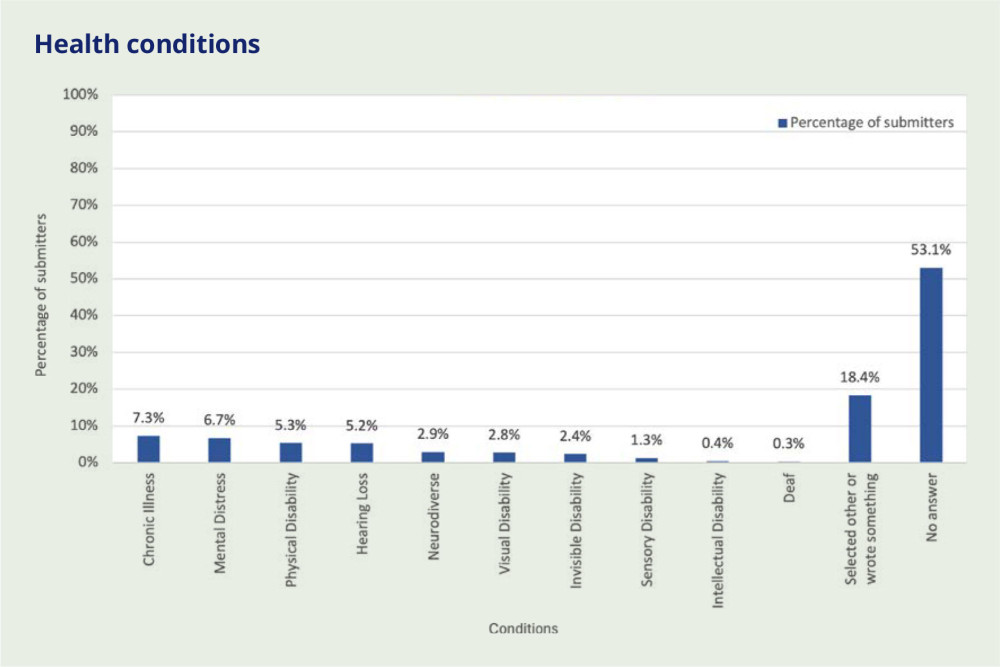
- 46.9 percent of submitters stated that they had a health condition.
- The most frequently reported health conditions were Chronic illness and Mental distress.
- Physical disability and Hearing loss were reported by just over five percent of submitters.
- Almost a fifth of submitters stated they had another health condition, these are listed below.
Commonly reported in health conditions in 'other':
- Mental health conditions (anxiety, depression, PTSD, CPTSD)
- Heart conditions (heart pain/issues/disease/failure, atrial fibrillation, arrythmia, myocarditis, pericarditis, angina)
- Chronic illnesses (diabetes, chronic fatigue, fibromyalgia, Long COVID-19, multiple sclerosis, chronic kidney disease)
- Autoimmune conditions (Crohn's, Hashimoto's, ulcerative colitis, psoriasis, thyroid problems, lupus)
- Blood related issues (high blood pressure/hypertension, clotting disorders)
- Neurological conditions (epilepsy, Parkinson's)
- Musculoskeletal conditions (arthritis, osteoporosis)
- Respiratory conditions (asthma, bronchitis, COPD, sleep apnoea)
- Sensory impairments and ailments (vision loss, hearing loss, tinnitus)
- Compromised immunity
- Allergies
- Injuries (that have ongoing impacts)
- Neurodiversity
- Skin conditions (psoriasis, eczema)
- Cancer
- Emotional problems
- Vaccine or pandemic induced ailments
Note: that many people used this space to express frustration or confusion about the purpose or intended use of collected demographic information or to make a statement to emphasise their position against the Government response to COVID-19. Lastly, some used this field to state their good health, which they attributed to having refused the vaccine.
Essential workers during lockdowns | Ngā kaimahi matua i ngā rā rāhui
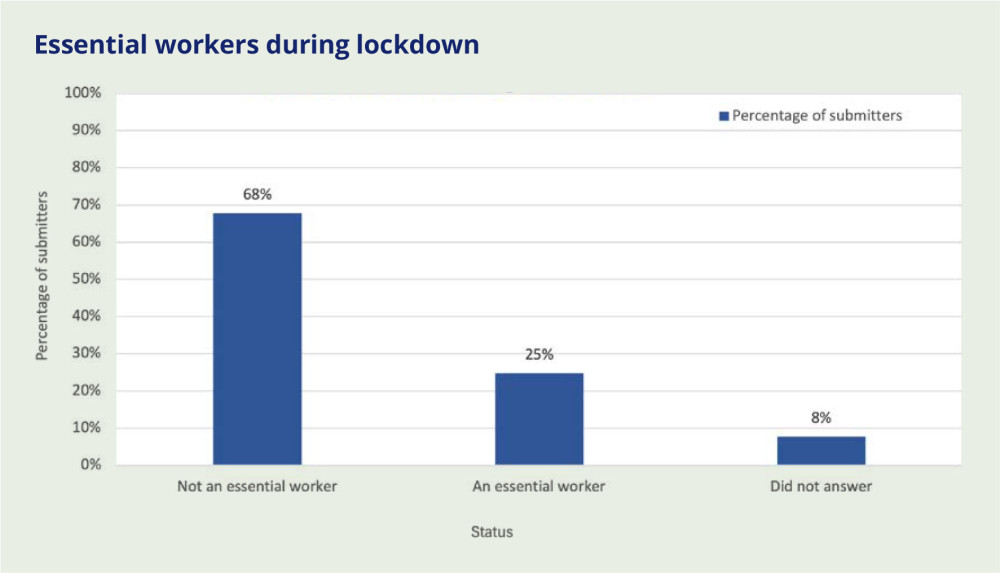
- The majority of submitters (68 percent) were not essential workers during the lockdowns
- One quarter of submitters were essential workers during lockdowns.
- 8 percent did not answer this question.
Who making the submission on behalf of | Mō wai i tukuna ai ngā tāpaetanga
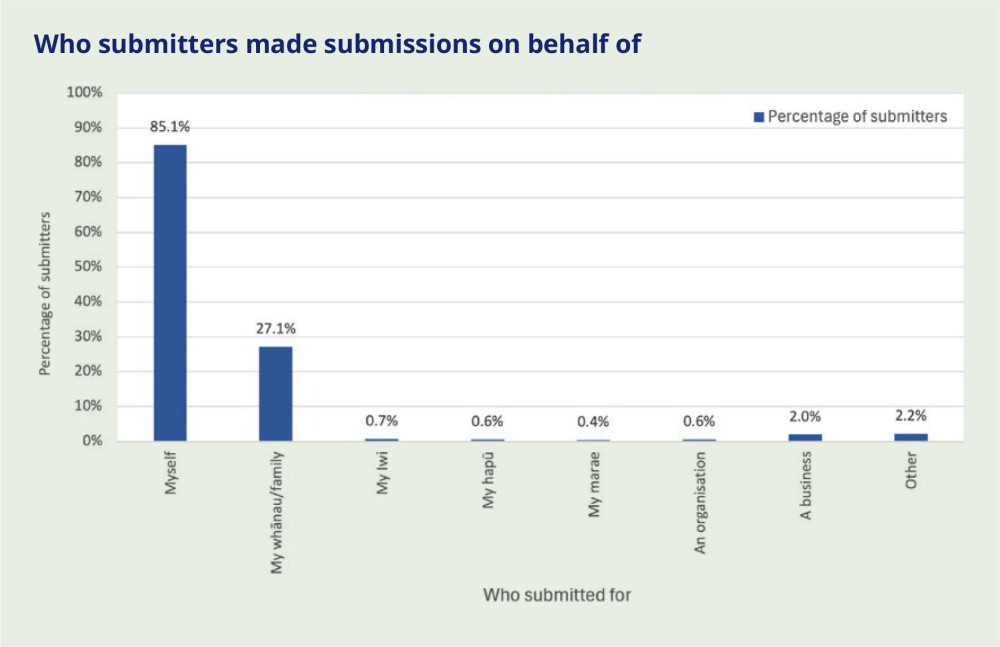
- By far the most submitters made the submission on their own behalf (87 percent).
- Approximately one quarter (27 percent) submitted on behalf of their whānau or family.
- A small proportion made a submission on behalf of a business (2 percent). Submissions made on behalf of someone's iwi, hapū, marae, or an organisation occurred infrequently.